
Report #1: Ending Homelessness Requires Good Data
We have not had timely or reliable data on our homeless situation. Even the number of people experiencing homelessness in the county was not known until recently. The January, 2023 Point-in-Time count reported 6,300 homeless people. Using the county’s By-Name-List, they reported 11,135 in January, 2024. Only in the last few days (April 16,2025) did the county publish a monthly report. Using the By-Name-List, they reported 14,864 homeless people in February, 2025. It is not clear how accurate this number is, but least we finally have a consistent time-line for this key metric.
The county does not even know how many shelter beds are available. JOHS (the county’s Joint Office of Homeless Services) reports on 2,457 shelter beds. A study by PSU says there are 3,149. And an unofficial spreadsheet by Portland Solutions, a department of the Portland mayor’s office, counts 4,764 shelter beds. The By-Name-List count from February, 2025 counted 4,860 of the homeless in shelters, with the shelters being 92% occupied (implying there are about 5,280 shelter beds). These large discrepancies indicate we just do not know the actual number. How can we manage the shelter system when we don’t even know how many there are?
We also need to know if the policy solutions are successful and cost-effective. Current governmental audits of the homeless service providers check for honesty and contract compliance, not if they are getting homeless people off the street. Hope for the Homeless is the only group we have found in Portland who tries to determine money spent vs. success rate. Of course, somebody with no medical disabilities who is recently homeless will cost substantially less to help than the chronically homeless, and there are many additional criteria that measure success.
HMIS reports progress in moving people into shelter and supportive housing, but not how many stay in these programs, nor whether the total number of unhoused on the street is increasing or decreasing. The number of disabled or homeless due to a medical emergency is poorly documented and often people are discharged from hospital stays onto the street.
The specific needs of the client, such as treatment for drug addiction or mental health; water or food; shelter whether temporary, transitional, or long-term supportive are often not asked or recorded. Hope for the Homeless, at least, is trying to determine if the vast sums of taxpayer money are being spent effectively. They use their data to select who receives their grants. The county and city need to do the same in deciding who gets their funding by broad and agreed criteria.
Chart from Hope for the Homeless

The data about a homeless person is supposed to be entered whenever a service provider has an interaction with them into a county-run software system called HMIS (Homeless Management Information System). However, the county’s HMIS software is out of date and inefficient. It does a poor job of sharing data among the 100+ service providers, and a poor job of tracking a homeless individual through their steps to recovery.
While the county is working on finding better software, it will not help unless the entire system works well. For example, today the county funds over 100 outreach workers, those front-line workers who contact the homeless, understand their needs, and get them into shelters. But the county funds these 100+ outreach workers through 20 different non-profit service providers, each with its own standards and procedures. Some do work intensively with the homeless to get them into services while others just give out food and water, or tents, sleeping bags, needles and straws. Some collect data on the homeless, some don’t. Throughout the system, many different organizations do things their own way, with little coordination.
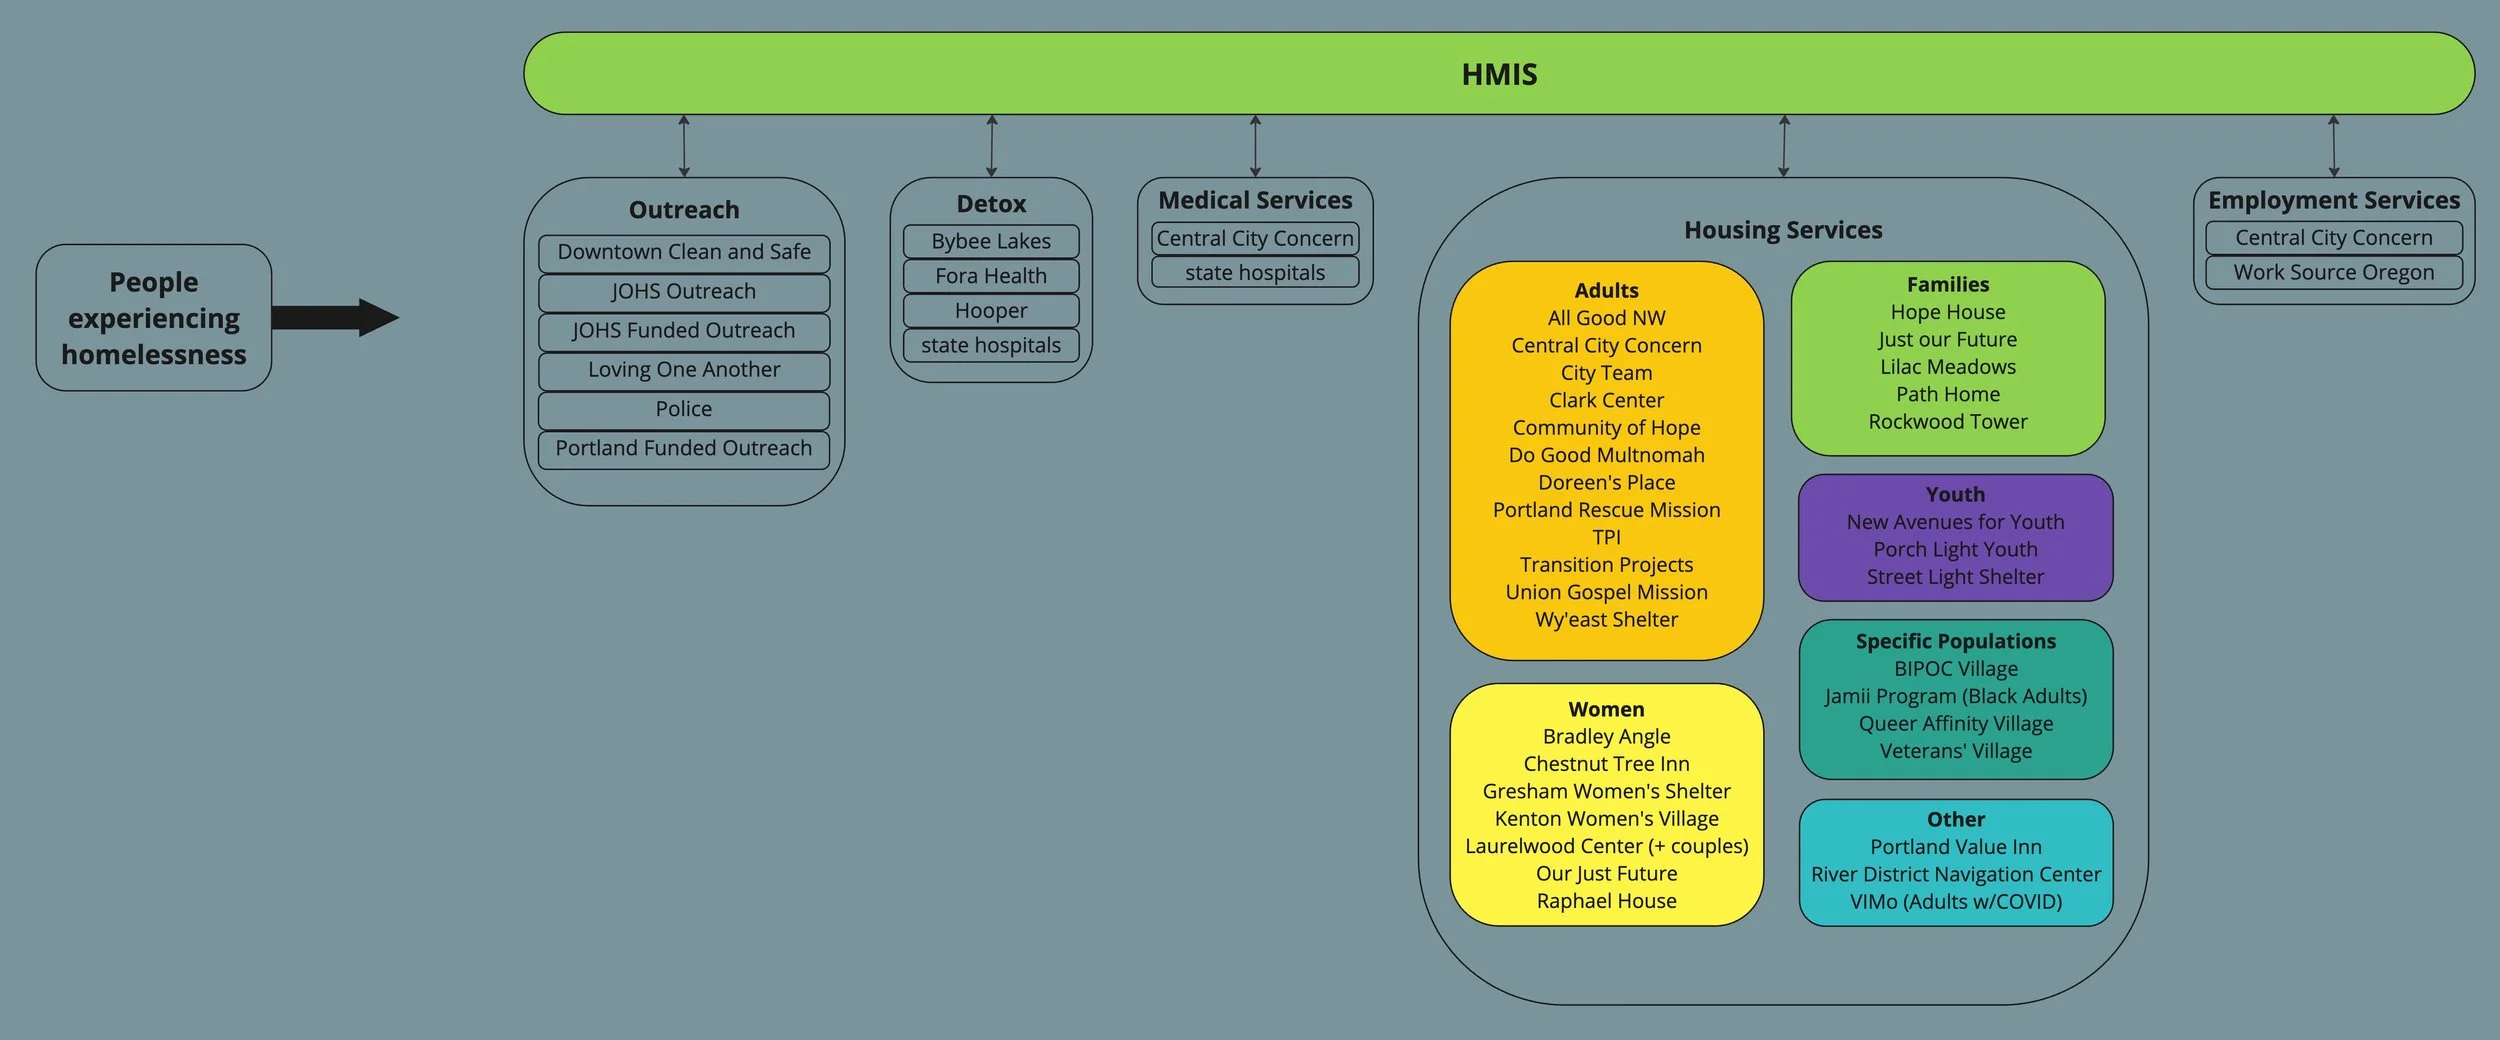
The chart below is one example of how a homeless management system should operate. This chart is not exhaustive; it shows less than half of the providers in Multnomah County.
How the HMIS could work
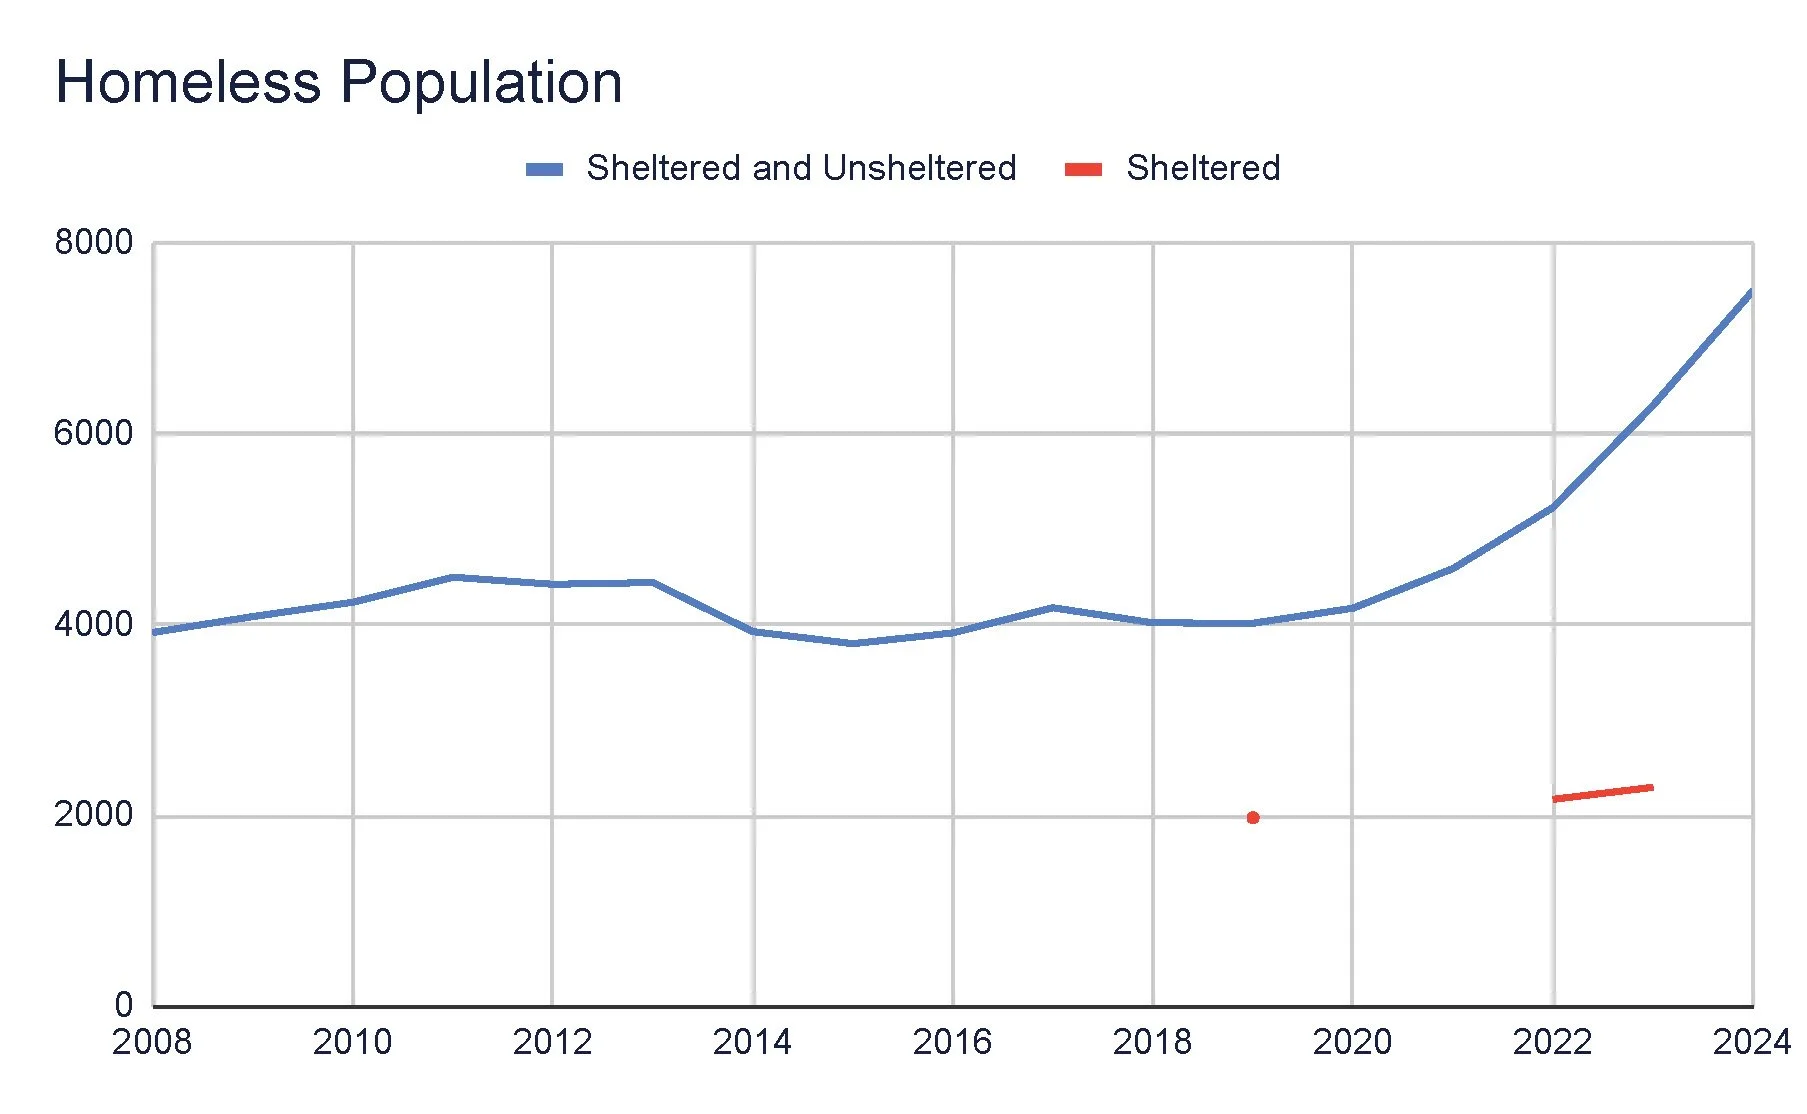
The end result of the way the county and city are handling the homelessness crisis is evident on our streets. The graph at the right shows people experiencing both sheltered and unsheltered homelessness combined in Multnomah County using Multnomah County Point-in-Time data. From 2008 until 2020 the population of people experiencing homelessness remained largely stable. In 2020 the pandemic coincided with an increase in homelessness in Multnomah County. From then, the population of people experiencing homelessness increased approximately 20% annually.
Multnomah County Homeless Population
In addition, Multnomah County has far more homeless people per capita than neighboring counties. Many say this is because more services are provided and the lax enforcement of drug and camping laws attracts homeless people from around the region and the country. Of the 6,300 hundred people counted as homeless by the point in time count in January 2023, 15% were from Multnomah County, 10% were from out of County, 75% were not asked or refused to answer. Place of origin would be important to shape some policies.
Portland Metro Area Point-in-Time Homeless Population Counts

Our huge public expense to reduce homelessness requires timely and consistent data on the size of our homeless population, how much of each service they need, and what services are available. This must include how successful our existing service providers are at achieving goals on a standardized set of measurements.
We need monthly unsheltered and sheltered homeless counts by neighborhood. We need counts for shelter utilization, behavioral health services such as detox and treatment, those in permanent supportive housing, and the success rates of programs, which is the ultimate measure of the success (or failure) of our policies. Much of the reporting that occurs now seems more geared to reporting to funders than the needs of the homeless.
For additional reading and resources related to this report, please visit works cited.
Photograph of Portland skyline licensed under Creative Commons from Scott Cameron