
Report #9 How (not) to Measure Accountability
Multnomah County funds 48 shelters. A standard management technique when you have many different entities providing similar services is to identify, analyze, and spread best practices. This improves the overall performance of the system and enhances accountability.
Broadly speaking, if you have 100 operating entities providing similar services, 50 will be above the median and 50 below. An assessment is necessary to identify the factors contributing to the success of certain operations (such as shelters), while others do not achieve similar outcomes. This analysis will help determine what leads to success, i.e. Best practices. Those who are underperforming should be trained to deploy these best practices and improve their operations. If they cannot improve, they should not receive further funding.
The report focuses on the county’s recent shelter report, but the same methodology would apply along the whole continuum of care of homeless services: outreach, detox and mental health stabilization, temporary and permanent supportive housing, employment training and placement, and ultimately graduation to full self-sufficiency.
The Report
In January 2026, Multnomah County Department of Homeless Services (DHS) published the “Adult Shelter Review FY2025.” This report is the first attempt by the DHS to make a cost-benefit comparison within its shelter operations. Unfortunately, it did not consider many criteria that would be necessary for a useful quantitative analysis. It does not help the county or its citizens hold the DHS or its many contractors accountable for the vast amounts of money they spend. A rigorous analysis and accountability are surely necessary, as they reported a mere 16% of shelter exits were deemed to be “successful” (or 12% if you look at the raw data ).
Costs and Benefits
The report compiles the costs of the 31 shelters that participated in the survey (out of 48 that the county funds), divided by the type of shelter.
But these are only operating costs. They do not include set-up or acquisition costs, nor do they include major maintenance. If these were included, we expect that alternate shelter (pod villages) would be more expensive than shown, and motels significantly more expensive than shown.
Each shelter also offered its own unique mix of services, ranging from housing navigation to substance use disorder (SUD) treatment to employment support, life skills, peer support, and others, making it difficult to achieve meaningful comparisons. Also, there is no attempt to determine how well the various services were delivered or to analyze the cost of providing these services, nor, with one exception (see page 4), their effects on outcomes. The report only notes that the shelter claims to have delivered the stated assistance.
Outcomes: Definitions of “Success”
The ultimate measure of any cost-benefit analysis, and the core for any measure of accountability, is the cost per successful outcome in similar conditions. So, what is “success”?
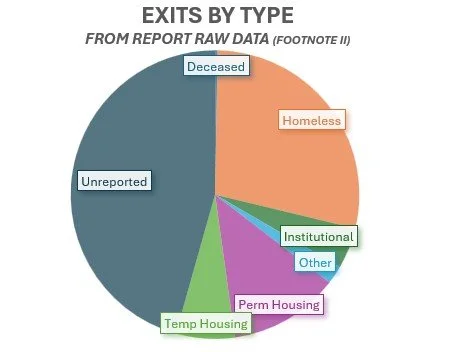
A pie chart depicting the Exits by Type from the raw data provided by DHS
In the DHS report, “success” is defined simply as an exit from a shelter to permanent housing. The report states that 16% of exits were “successful” (versus three quarters of the exits that were either unknown or returns to homelessness). This woeful “success” rate is based on the county’s Housing First/Housing Only policies, which require providers to focus on getting the homeless into permanent housing, without regard to the individual’s condition. There was no measure of how long the individuals retained their permanent housing. But a placement that ends with the individual being evicted a few months later should not be considered a “success”.
While we agree that the end-goal of homeless services is to get people into permanent housing, many individuals need one or more intermediate steps. These intermediate steps frequently include withdrawal management/detox, stabilization, and weeks or months of extensive support. For those with severe mental health problems, it may include long-term institutional care. (Portland Voice Behavioral Health Report)
In this study, 5% of exits were listed as exits to “institutional settings”, which is defined as “treatment facilities, care homes, etc.” In many cases, this could be exactly what the individual needs and should be considered a success. Many of the chronically homeless are also addicted to drugs or alcohol and need to be sober and stabilized before they are ready for permanent housing, as confirmed by the Central City Concern Report of September 2025.
Another oddity in the study’s data is that those who transfer to different shelters are listed as “Exit to Homelessness”. Again, a transfer from a congregate shelter to a motel shelter might actually be a step toward recovery, but it is not listed as such.
Portland Voice defines success as moving forward along the road to recovery. In some cases, that is permanent housing, for some it is withdrawal management, for others it may be another outcome. But in each case, there needs to be an individual recovery plan, with clear steps along the path to recovery. Not valuing the discrete intermediate steps is not useful.
Ignoring Behavioral Health (BH) and Drug Addiction
As is usual in DHS reports, shelter participants are divided into 9 categories of ethnicity and 4 genders, and the differences between shelters in these areas are highlighted.
But it does not categorize shelter participants by their behavioral health conditions and/or drug addiction, which are common among the homeless and are major barriers to successfully exiting homelessness. Analyzing shelter participants and shelter exits by whether the individuals were suffering from BH issues or drug addiction would surely shed light on the situation and enable comparisons between shelters. But HSD does not even try to collect the data.
“Chronic homelessness” might have been used as a proxy for BH, as the majority of the chronically homeless have BH problems. The report did show the percentage of “chronically homeless” by shelter, and it did find some differences between shelter types in terms of percentages of chronically homeless served. But no attempt was made to analyze it from a cost-effectiveness point of view. And no attempt was made to analyze the exits, “successful” or otherwise, by whether or not the individuals were chronically homeless.
Report Conclusions
Due to differences in shelter types, sizes, entry requirements, and the unique mix of support and services offered in each shelter, it is difficult or impossible to compare their cost-effectiveness (which, of course, is the whole purpose of such comparisons).
The only recommendation the DHS report offers is to consider reducing the number of shelter beds and using the savings to increase the number of housing assistance workers in the remaining shelters. The data indicate that this might marginally increase the exits to permanent housing, but there is no discussion of other impacts.
Given the low shelter-to-housing rate and the constantly increasing number of homeless in the county, this sounds like rearranging deck chairs on the Titanic.
Case Study: St. John’s Village
For an example of the questions that should be asked, we can use the case of St. John’s Village, a shelter of 19 beds primarily for veterans. Its FY 2025 budget was $512,000; it served a total of 45 individuals, and out of 30 exits, 13 (43%) were to permanent housing. In summary, it spent $27,000/bed, much less than average, and had 43% “successful” exits, much higher than average.
DHS does not ask the obvious question: What are they doing right? Is it how they select incoming participants? Veteran benefits? Better use of housing assistance workers? Their mix of services? The quality of their service staff? Or something else? And most importantly, can whatever it is they are doing right be implemented at other shelters?
Our Conclusions and Recommendations
The DHS report required a lot of time, money, and effort to compile, and it is the first attempt we have seen at a cost-benefit analysis. However, it does little other than show the current system is not working. A 16% “success” rate at a cost of $114,000 per “success” is not good.
The purpose of a cost-benefit analysis of the 31 shelters is to identify those that are underperforming and, using the examples of those that are better than average – like St. John’s Village -- to help the others improve. By simply accepting the wide mix of services offered by the various shelters and making no attempt to evaluate how effective those services are at each shelter, the report leaves no way to evaluate or improve shelter performance.
Our recommendations include:
● Make a standard list of services that each type of shelter must provide and evaluate how they are delivered.
● Include Behavioral Health/drug and alcohol addiction data for individuals and shelters.
● Develop an Individual Recovery Plan for each individual and evaluate service providers on how effective they are in moving the individual along that path, recognizing that for many individuals, there will be several steps between homelessness and permanent housing.
● When calculating the cost part of the cost-benefit analysis, use the true costs by including capital and maintenance costs incurred by the county along with operating costs.
Sources:
[1] There are several inconsistencies between what the report states and the raw data provided at the end of the document. For example, the report states on page 13 that there were 5,213 total exits. On page 35, it states there were 5,856. Adding up the raw data shows there were 6,910 exits. There is no explanation of the discrepancies. The exit percentage depends on the denominator you use.
[2] The chart is based on summing up the raw data provided for each shelter. Spreadsheet is available on request
[3] The 31 shelters had $98 million in operating costs, and the report claims 857 exits to permanent housing = $114,000 per exit. The $98 million does not include the costs of the permanent housing, nor does it include the capital and major maintenance costs of the shelters.